
Measuring QB Performance: Predicting NFL Interceptions
By: Mihir Mathur, Carnegie Mellon Sports Analytics Club

When it comes to evaluating quarterback (QB) performance, interceptions often play a pivotal role. They can make or break a game, swing momentum, and are frequently scrutinized by analysts. In this project, I sought to predict NFL interceptions, not just as a defensive strategy tool, but as a way to measure QB performance. By developing a new metric, "Interceptions Over Expected (IOE)," we can assess how quarterbacks perform relative to the interceptions they should have thrown, given specific game conditions.
Feature Engineering: What Influences an Interception?
To accurately predict interceptions, I engineered features that capture the in-game situations where turnovers are most likely to occur. Among the key features were:
Down
Number Of Pass Rushers
Yards to Go
Defensive Pressure (hurries, knockdowns): Was there pressure on the QB at the time of the throw?
xpass
Obvious Passing Situations: A notable feature I engineered was whether the play occurred in an "obvious passing" situation, particularly on 3rd and 7+ yards. These situations heavily favor the defense, as they can anticipate the pass and apply greater pressure.
In addition, I included situational variables like the game seconds remaining and yardline, which further contextualized the pressure a QB faces in key moments.
Model Choice: XGBoost for Accuracy and Feature Interpretation
After testing multiple models, XGBoost emerged as the optimal choice due to its ability to model complex interactions between features. The feature importance graph below highlights which factors played the most significant role in predicting interceptions:
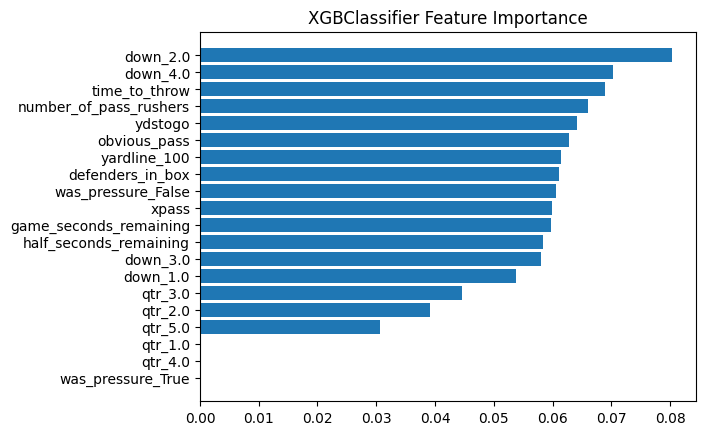
The graph illustrates that "obvious passing" situations, especially on 3rd and long downs, were crucial predictors of interceptions. Other top features include the time to throw, the number of pass rushers, and if it was a 4th down. This reaffirms that quarterbacks are at the highest risk of interception when they’re in predictable passing downs, face significant pressure, and have limited time to make decisions.
Introducing "Interceptions Over Expected" (IOE)
With the XGBoost model in place, I developed the Interceptions Over Expected (IOE) metric. This metric compares how many interceptions a quarterback is expected to throw based on the model’s predictions against how many they actually threw. A negative IOE indicates a QB who avoids turnovers better than expected, while a positive IOE suggests a higher-than-expected interception rate.
This metric offers a more refined view of QB performance, as it takes into account the pressure, situation, and play context rather than just raw interception numbers. QBs with a low IOE may be exceptional decision-makers under pressure, whereas those with a high IOE may struggle in critical moments.
Visualizing IOE: Total Touchdowns vs Interceptions Over Expected (2023)
The following graph plots Total Touchdowns vs Interceptions Over Expected (2023), comparing quarterbacks across the NFL:
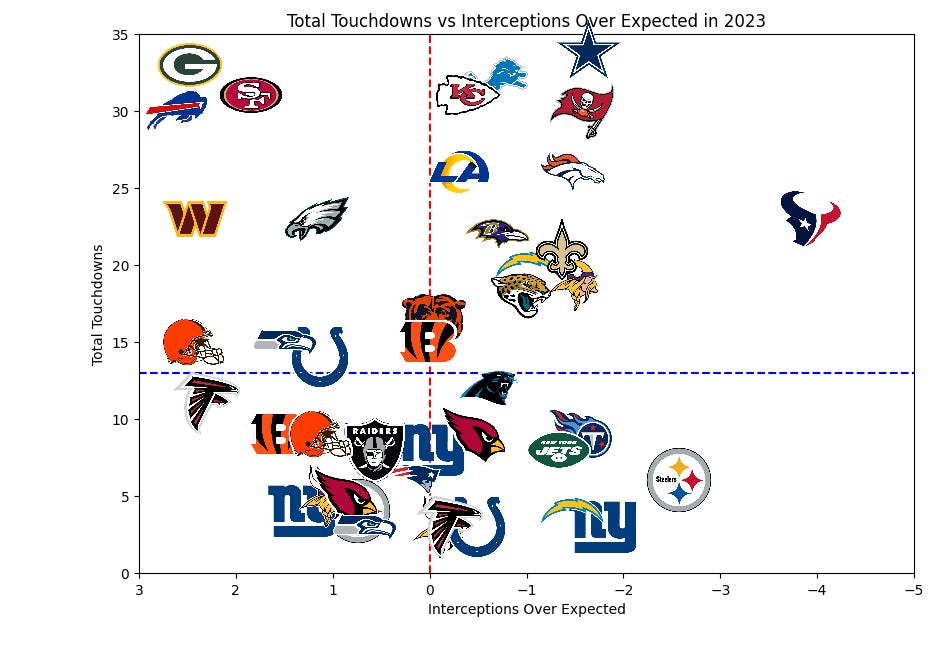
In the top right quadrant, we see standout performances from quarterbacks like C.J. Stroud (Houston Texans), Baker Mayfield (Tampa Bay Buccaneers), and Dak Prescott (Dallas Cowboys). These players had high touchdown totals while throwing fewer interceptions than expected, showing a strong ability to both generate scoring opportunities and protect the ball. Their success in 2023 can be largely attributed to this balance between risk and reward.
Conversely, QBs in the bottom left quadrant underperformed, throwing more interceptions than expected and producing fewer touchdowns, which may indicate poor decision-making under pressure or challenges with reading defenses.
(Note: Repeat Logos means there were different starting QBs for that team)
Strategic Takeaways: How Teams Can Use This Analysis
By analyzing QB performance through the lens of interceptions, teams can:
Evaluate Decision-Making: The IOE metric allows coaches to better understand how well their quarterback handles pressure situations and avoids turnovers.
Game Planning: Defensive coordinators can exploit QBs with a high IOE by focusing on predictable passing situations like 3rd and long.
Player Development: Identifying QBs with high IOE can highlight areas for improvement, particularly in decision-making under pressure.
Conclusion: A New Metric for Evaluating QBs
Interceptions are a key part of football, and understanding when and why they happen provides insight into QB performance. The "Interceptions Over Expected" metric offers a new perspective, highlighting quarterbacks who excel under pressure and avoid costly mistakes. The analysis from the 2023 season illustrates how players like C.J. Stroud, Baker Mayfield, and Dak Prescott stand out not just for their touchdowns, but for outperforming expectations in avoiding interceptions.
As I continue refining this model, I plan to incorporate additional factors like weather conditions, pass-rush schemes, and further situational data to improve predictive accuracy.
Code: https://colab.research.google.com/drive/1tmehSoeSODDzV5KjWpAi_cFkmqYLXlio?usp=sharing